[ CVEX News | Updates from the CVEX ecosystem ]

CVEX Insights

Guides
5 min read
CVEX TG App Onboarding Guide

Learn how to trade crypto futures easily with the CVEX Telegram Trading App. This step-by-step guide covers account setup, deposits, and placing trades.

CVEX is thrilled to introduce our very own Telegram Trading App. It’s a major step forward in bringing DeFi clearing infrastructure to the masses. With millions of traders and crypto enthusiasts already active in the Telegram ecosystem, we’re making crypto futures trading easier, more secure, and cost-efficient. Right where you are.

To help you get started, we’ve created a simple, step-by-step onboarding guide tailored specifically for our TG community.

Disclaimer: This guide is for informational purposes only and does not constitute financial advice or a call to action. The features and functionalities described in this text may differ from those available in the actual application or may not be implemented at all. Always conduct your own research and trade responsibly.

Authorisation 

Unlike traditional Telegram-based exchanges, our authorisation process follows a different sequence of steps. This approach allows us to maintain full compatibility with EVM and the Arbitrum blockchain, ensuring lower fees and faster transactions. Now, let's walk through the sign-up process.

Step 1: Create a PIN Code

After clicking “Sign Up”, you’ll be prompted to set up a PIN code. This PIN is your first layer of security, protecting your account from unauthorised access. Enter a secure PIN and confirm it to proceed.

Step 2: Set Up a Recovery Method

Forget complicated seed phrases! We've opted for a more familiar and user-friendly recovery method: security questions. If you ever need to restore access, simply answer a control question. Just like in the early days of the internet.

Example:

What was the name of your first pet?

→ Satoshi Liquidoto

You can find a visual guide in the screenshots below.

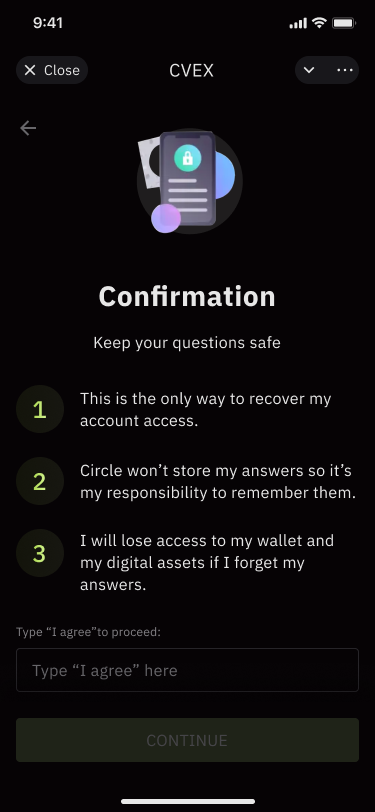
Step 3: Final Confirmation

⚠ Important: If you forget both your PIN and recovery answers, you will lose access to your wallet. We highly recommend writing them down and keeping them safe.

To finalise your setup, simply type “I agree” and click Continue on the confirmation screen.

Once you’ve completed these steps, you’re all set to start trading seamlessly within Telegram! 

Depositing

To trade, you’ll need stablecoins, right? We’ve made depositing as effortless as possible. So, even if it’s your first time dealing with crypto, you’ll know exactly what to do.

You’ll have three options to deposit:

  • USDC via Arbitrum One
  • TON or USDT via TON network
  • Almost every other crypto via ChangeNow network
  • Fiat (coming soon)

Here’s how it works:

Step 1: Setting Up Your Deposit

Tap “Deposit” on the Home page. Next, choose your preferred payment method and enter the amount of crypto you’d like to deposit (ChangeNow and TON network) or just copy the address (using Arbitrum One). Whether it’s a stablecoin or any other crypto, we’ve got you covered. 

Pay attention that your deposit will be automatically converted to USDC.

Step 2: Review & Proceed

Before sending funds and approving, double-check all transaction details. Then copy the address (for TON and Arbitrum One) and send the amount of funds you want to deposit. When it’s done, hit “I’ve sent funds” to move forward.

Step 3: PIN & Final Confirmation

For security, enter your PIN code (the one you created during authorisation). Then, wait a little bit until the blockchain proceeds your transaction.

When the transaction will be finished, you’ll receive a notification. 

Please carefully read all the instructions on the screen during depositing. Features are subject to change without prior notice, so this guide may be irrelevant at some points.


Trading

Trading on CVEX’s Telegram app is designed to be effortless, even for first-time users. Just follow these three simple steps:

Step 1: Choosing a Contract

Head over to the “Trade” tab. At the top of the screen, you’ll find a list of available contracts. Select the asset you want to trade. Let’s use BTC as an example.

Step 2: Placing an Order

Currently, the app supports market orders for buying and selling. Simply choose whether you want to open a long or short position, then enter the amount of stablecoins you’d like to trade.

Step 3: Confirming Your Order

To finalise your trade, confirm the transaction in your wallet and enter your PIN code for security.

Once your first position is open, you can track your portfolio anytime in the “Home” tab. Happy trading! 

Follow CVEX for news and crypto information

Top 3 articles

View all
5 min read
Introducing Achievements on CVEX!

Achievements are in-app rewards, that a tester receives for a certain action in our Testnet. At the moment, there are already a few dozen Achievements available. But we will expand the list every fortnight and inform the community about it.

Here's a kicker: conditions required to get a particular Achievement are unknown. Therefore, we invite you to experiment in our trading terminal, make the most of the testnet and other marketing activities to unlock as many achieves for your account as possible.

Remember that some Achievements are given not for a single event, but for a sequence of actions or prolonged activity. So be patient to earn them all!

Why Do You Need Achievements?

Each Achievement you receive will give you three things:

  1. The joy of collecting;
  2. A reason to discuss it with your friends;
  3. Extra XP points;
  4. 👀.

No one knows how XP points will convert into real benefits for testnet users. But if you take a magic ball and ask it if it's worth getting Achievements, it will say yes. We believe in magic, how about you?

Achievements are divided into 4 levels of difficulty:

  • Common;
  • Rare;
  • Epic;
  • Legendary.

The higher the level of the achievement, the more XP points you will get for it. But the action at Legendary rank will be much harder than at Common rank, of course. 

Earning Your First Achievement

Now, let's get your first Achievement (and 20 XP points at the same time). 

Step 1. Log in to the CVEX trading terminal.

Go to our trading terminal and perform all the actions necessary to start trading (connecting your wallet and funding your test account). You can read more about them in our Testnet guide:

https://cvex.xyz/post/the-official-cvex-testnet-guide 

Step 2. Making your first transaction with futures.

Now you need to make your first transaction. To do this, choose any contract you are interested in, for example, BTC-28JUN24.

After that, select "Market" in the Place Order section.

Enter the amount for which you want to open a trade and click the Place Buy button.

Step 3. Check the progress and rejoice.

Voila, you should have received your first Achievement for this simple action. Go to the website and check your progress. 

Note that it may take time for the platform to credit you for the achievement, so wait a little while. If after a while, the achievement still hasn't appeared in your profile, then contact our helpful community managers in Discord.

Conclusion

Achievements are a great opportunity to earn extra XP points on CVEX by performing non-standard actions and having fun on our testnet. We look forward to seeing you at the top! Happy testing!

Find us here:

Website — https://cvex.xyz/ 

Twitter — https://twitter.com/cvex_xyz 

Discord — https://discord.com/invite/DRma7Z9BTz 

Achievements lending — https://affiliate.cvex.trade/achievements

5 min read
Initial and Required Margin. Margin Utilisation

Managing risk effectively is critical to both short-term success and long-term sustainability. This blog explores how CVEX employs advanced financial models like Value-at-Risk (VaR) to determine initial and required margins, ensuring that traders can effectively manage their portfolios against potential losses. Understanding these concepts is essential for any trader looking to optimise their strategies and maintain financial health in the volatile crypto market.

Understanding Initial and Required Margin

What is Required Margin?

Required margin is the amount of equity a trader must maintain in their trading account to keep their positions open. It is calculated based on the potential losses a portfolio might incur within a specific period and confidence interval, known as the Value-at-Risk (VaR). This metric helps ensure traders have enough capital to cover potential losses predicted by market movements.

What is Initial Margin?

Initial margin refers to the minimum amount of capital required to open a new trading position. This margin is set higher than the required margin to provide a buffer against market volatility. It ensures that there is sufficient capital in the account to withstand price fluctuations soon after entering a trade, thus protecting against premature liquidations.

These margins are crucial components of risk management on the CVEX platform, helping traders manage their exposures prudently while allowing them to leverage their positions effectively.

CVEX Margin System Explained

Calculating Required Margin with Value-at-Risk (VaR)

At CVEX, required margin is not just a static number; it is dynamically calculated using the Value-at-Risk (VaR) model, which estimates the potential maximum loss a trader's portfolio might face over a specific time frame at a given confidence interval. This approach allows for a more tailored risk management strategy that aligns with market conditions and the individual trader's exposure.

Imagine a trader, Alice, who holds various cryptocurrency positions in her portfolio. The CVEX system calculates the VaR to determine a potential maximum loss of $900 over a day with 95% confidence, given current market conditions. This $900 becomes the required margin Alice needs to maintain to keep her positions open.

Initial Margin and Its Role in Risk Management

The initial margin is set higher than the required margin to create a safety buffer for the account. This buffer helps manage the risk of market volatility that might occur right after a position is opened, thus preventing premature position liquidations if the market moves against the trader unexpectedly.

Using the previous scenario with Alice, if the required margin based on her VaR is $900, CVEX might set her initial margin at $1125 (25% higher than the required margin). This extra margin ensures that Alice has enough capital in her account to cover potential losses shortly after entering her trades, providing a cushion against immediate market drops.

Margin Ratio: Monitoring Collateral Health

The margin ratio is a critical measure on CVEX that indicates the health of a trader's collateral relative to their required margin. A ratio below 100% suggests that the trader's portfolio is well-collateralised and can withstand some degree of market fluctuation without triggering a margin call or liquidation.

If Alice's total equity in her trading account is $1200, and her required margin is $900, her margin ratio would be calculated as: 900/1200×100=75%. This ratio indicates that Alice's account is sufficiently collateralised.

Integrating Margin Management in Trading Strategies

Understanding and effectively managing required and initial margins is crucial for traders to maximise their strategic outcomes. By keeping a healthy margin ratio and being aware of how close they are to their initial margin thresholds, traders can avoid unwanted liquidations and better plan their entry and exit strategies in the market.

Conclusion

Understanding and managing margins is essential for effective trading on CVEX. By utilising the Value-at-Risk model to calculate required margins and setting a higher initial margin, CVEX ensures that traders like Alice are well-prepared for market fluctuations. This system safeguards traders from sudden market movements and empowers them to make informed decisions, optimising their trading strategies under various market conditions. Adequate margin management is key to maintaining portfolio health and achieving long-term trading success, enabling traders to confidently and securely navigate the dynamic crypto market.

5 min read
Guide on Crypto Technical Analysis

The role of technical analysis has become increasingly pivotal. This method, which employs historical price data and market trends to forecast future price movements, offers a structured approach to navigating the often turbulent crypto markets. By analysing crypto charts and utilising a range of technical indicators, traders can glean insights into market sentiment and make more informed trading decisions.

The aim of this blog is to demystify the complex world of technical analysis for crypto traders. From the foundational use of candlestick charts to the nuanced interpretation of support and resistance levels, we delve into the tools, techniques, and indicators that are indispensable for anyone looking to harness the power of technical analysis in their trading strategy. Whether you're evaluating the momentum through RSI (Relative Strength Index) or assessing market volatility with Bollinger Bands, understanding these elements can significantly enhance your ability to spot lucrative trading opportunities in the cryptocurrencies market.

As we explore these aspects, our focus will be on how traders can effectively employ technical analysis to identify market trends, anticipate price movements, and refine their trading strategies. This comprehensive guide aims to equip traders with the knowledge and tools needed to navigate the crypto market trends with confidence and precision.

The Essence of Technical Analysis in Crypto

Technical analysis stands as a cornerstone in the realm of cryptocurrency trading, offering a systematic approach to deciphering the market's future direction based on historical price actions and volume data. This methodology, grounded in the analysis of crypto charts, enables traders to anticipate market trends, thereby facilitating informed trading decisions. Its relevance in the crypto market is profound, given the volatility and rapid price changes characteristic of digital currencies. Through technical analysis, traders can sift through the noise, identifying patterns and signals that indicate potential price movements.

The roots of technical analysis stretch back to the late 19th century with Charles Dow, co-founder of Dow Jones & Company and a pioneer in market analysis. Dow's insights, encapsulated in what is now known as Dow Theory, laid the groundwork for modern technical analysis. Dow Theory posits that market prices reflect all available information and that prices move in identifiable trends that are likely to continue until a clear reversal occurs. This theory emphasises the importance of price movements, distinguishing between primary trends, secondary movements, and minor fluctuations.

Over the years, technical analysis has evolved, adapting to the changing landscapes of financial markets. Its application has expanded beyond traditional stock markets to include commodities, indices, and notably, cryptocurrencies. The principles of Dow Theory still underpin much of today's technical analysis, providing a framework for understanding market dynamics. In the context of the crypto market, these principles guide traders through the intricacies of market sentiment, offering tools like candlestick charts, trend lines, and volume indicators to navigate the digital asset space effectively.

As we delve deeper into the essence of technical analysis in crypto, it's clear that the approach is not just about predicting future prices but about understanding the market's underlying trends and behaviors. This knowledge empowers traders to make strategic decisions, harnessing the potential of the crypto market while mitigating risks associated with its volatility.

Core Tools and Charts

The arsenal of tools at a trader's disposal is vast, with charts standing as the cornerstone for insightful analysis. Among the plethora of options, candlestick charts, line charts, and bar (OHLC) charts each serve a unique purpose, tailoring to various trading strategies and preferences. Below, we delve into the essence of these core tools, elucidating their significance and optimal use cases in the crypto trading landscape.

Candlestick Charts

Candlestick charts, with their origins in 18th-century Japan, offer a visually rich representation of price movements. These charts are distinguished by their detailed depiction of the open, high, low, and close (OHLC) prices within a specific timeframe. The body of the candle illustrates the distance between the opening and closing prices, while the wicks or shadows extend to the high and low prices. This configuration not only conveys the price range but also provides insights into market sentiment and potential reversals.

Best For:

  • Detecting reversal patterns
  • Understanding market sentiment
  • Visualising price volatility

Line Charts


Line charts stand as the epitome of simplicity, connecting the closing prices over a set period. This streamlined approach offers a clear perspective on the trend's direction, stripping away the complexity of minute price variations. For traders whose strategies are grounded in long-term movements rather than short-term fluctuations, line charts provide an uncluttered overview of market trends.

Best For:

  • Long-term trend analysis
  • Simplifying complex market data
  • Quick assessment of market direction

Bar Charts (OHLC)


Bar charts, similar to candlestick charts, present the OHLC values but without the same visual emphasis on the relationship between the opening and closing prices. Each bar reveals the high and low prices as the vertical line, with small ticks indicating the opening (left tick) and closing (right tick) prices. This format caters to traders seeking a detailed yet less visually intense alternative to candlesticks.

Best For:

  • Traders seeking detailed market data
  • Those who prefer a straightforward visual representation
  • Analysis requiring attention to open, high, low, and close values

Comparative Analysis

Here's a concise table comparing these chart types to guide traders on when to utilise each:


Choosing the right chart type is a strategic decision that aligns with a trader's specific analysis needs and trading style. Whether it's the comprehensive detail of candlestick charts, the simplicity of line charts, or the balanced detail of bar charts, each tool offers unique insights into the crypto market's ever-evolving dynamics.

Technical Indicators and Their Applications

In the quest to decipher the complex tapestry of cryptocurrency markets, traders lean heavily on technical indicators as their compass. These tools, grounded in mathematical computations, translate raw data into actionable insights, guiding trading decisions with precision. Among the myriad of indicators available, Moving Averages, RSI (Relative Strength Index), and MACD (Moving Average Convergence Divergence) are particularly revered for their effectiveness in shedding light on market trends and momentum. Here, we delve into each of these indicators, unraveling their applications and offering examples to illustrate their utility in the volatile world of crypto trading.

Moving Averages

Moving Averages smooth out price data to identify the trend direction over a specified period. Traders employ Simple Moving Averages (SMA) for a straightforward average of prices, while Exponential Moving Averages (EMA) give more weight to recent prices, responding more quickly to price changes. 

For instance, in a volatile asset, a trader might use a 50-day EMA to gauge the long-term trend, while employing a 10-day EMA to make timely trading decisions based on short-term movements. When the short-term EMA crosses above the long-term EMA, it's a bullish signal, suggesting it might be time to buy. Conversely, a cross below signals a bearish outlook, potentially indicating a sell.

RSI (Relative Strength Index)

The RSI is a momentum oscillator measuring the speed and change of price movements, operating within a range of 0 to 100. It helps identify overbought or oversold conditions, offering clues about potential reversals.

At an RSI below 30, signaling that it might be oversold. This could indicate a buying opportunity for traders, predicting that the market sentiment might soon pivot towards bullish, leading to a price increase. Conversely, RSI above 80 may signal about overbought and bearish potential.

MACD (Moving Average Convergence Divergence)

MACD is a trend-following momentum indicator that shows the relationship between two EMAs of a cryptocurrency. The MACD line (the difference between the 12-day and 26-day EMA) and a signal line (9-day EMA of the MACD line) can indicate buy or sell signals. 

A trader might watch for the MACD line to cross above the signal line as a bullish indicator, suggesting an opportune moment to enter a long position. Conversely, a cross below could signal a potential downtrend, prompting a decision to sell or short.

Bollinger Bands

Bollinger Bands consist of a middle band being a moving average, flanked by two standard deviation bands above and below it. This indicator is a measure of market volatility; narrow bands indicate low volatility, while wide bands signal high volatility. 

For traders, Bollinger Bands can serve as a critical tool for identifying potential market entry or exit points. A price touching the upper band could be seen as overbought, suggesting a possible sell signal, whereas a touch of the lower band might indicate oversold conditions, hinting at a buying opportunity. The key is to look for the price to bounce back from these bands, indicating a potential reversal in momentum.

Volume Indicators: OBV

The On-Balance Volume (OBV) indicator uses volume flow to predict changes in stock price. By cumulatively adding or subtracting each trading session's volume based on the direction of the price move, OBV offers insights into the strength of market trends. 

In the context of futures, a rising OBV suggests that buyers are in control, possibly leading to higher prices. Conversely, a falling OBV indicates that sellers might be dominating, potentially driving prices down. Traders might use OBV in conjunction with other indicators to confirm a trend's strength or weakness, integrating this analysis into their decision-making process for entering or exiting trades.

Trend Lines and Channels

Trend lines are straight lines drawn on charts that connect a series of prices to identify the general direction of the market. An uptrend line is drawn along the lows of an upward-moving market, indicating support levels where buyers are expected to enter the market. Conversely, a downtrend line is drawn along the highs, showing resistance levels where sellers might take control. 

Channels form when a parallel line is drawn on the opposite side of the trend line, creating a price range within which the asset moves. Recognising these patterns can significantly impact trading strategies by highlighting potential breakout or reversal points, thereby guiding traders on when to buy or sell.

Support and Resistance Levels

Support and resistance levels are key concepts in understanding market psychology and predicting future price movements. Support levels are price points where a downtrend can be expected to pause due to a concentration of demand. 

Resistance levels, conversely, are where a trend can stall or reverse due to a surge in supply. These levels are pivotal as they represent the collective decision-making of the market's participants, influenced by their perceptions, psychology, and actions. 

Identifying these levels helps traders anticipate potential reversal points, offering strategic opportunities for entry or exit. The importance of these levels lies in their ability to signify areas where the sentiment of the market could change, driven by the principles of supply and demand.

Step-by-Step Guide to Combining Indicators

  1. Identify the Market Trend. Use moving averages to determine the market's general direction. A rising moving average indicates an uptrend, while a declining moving average points to a downtrend.

  1. Assess Market Momentum. Apply RSI and MACD to gauge the strength and momentum of the trend. High RSI levels might suggest overbought conditions, signaling a potential reversal in an uptrend, whereas low RSI levels could indicate oversold conditions in a downtrend.

  1. Determine Potential Reversal Points. Employ Fibonacci Retracement levels for uptrends and downtrends to identify possible reversal zones where the market might stall or reverse.

  1. Confirm with Volume Indicators. Utilise OBV to confirm the trend’s strength. An increasing OBV in tandem with rising prices confirms an uptrend; a decreasing OBV with falling prices confirms a downtrend.

  1. Set Entry and Exit Points. Use Parabolic SAR to identify suitable entry and exit points, ensuring trades are aligned with the trend's direction.

Case Study

A trader analysing the ETH28Jun market might start with a daily moving average to spot the general trend direction. Upon identifying an uptrend, the trader examines the MACD for momentum and the RSI for potential overbought conditions. Noticing a retracement, the trader uses Fibonacci levels to pinpoint potential entry points at significant support levels. OBV confirms buying pressure, and the Parabolic SAR indicates it's time to enter the trade.

This trader successfully combines these indicators, allowing for a nuanced understanding of market movements and the execution of a well-timed entry, significantly increasing the likelihood of a profitable outcome. This methodical approach exemplifies how integrating various technical analysis tools can enhance trading decisions, turning the unpredictable nature of crypto markets into manageable, calculated risks.

Wrapping Up

Technical analysis stands as a beacon for navigating the tumultuous waters of the crypto market. By dissecting past price movements and volume trends, traders equip themselves with the foresight to anticipate future market behaviors. This guide has ventured through the core principles and tools of technical analysis, from understanding candlestick patterns to deciphering complex indicators like the MACD and RSI, all aimed at enhancing your trading acumen.

Embracing these techniques is not merely about following charts and numbers; it's about cultivating a disciplined approach to trading, where every decision is informed by analysis rather than intuition. As you integrate these methods into your trading strategy, remember that proficiency comes with practice and patience. Dive into the world of technical analysis, where informed decision-making and effective risk management can transform the volatility of the crypto market into opportunities for growth.

FAQ

What is the best technical analysis indicator for crypto trading?

There isn't a universal indicator that suits all trading strategies. Successful crypto trading often requires a blend of several indicators to provide comprehensive market insights, tailoring your approach based on specific market conditions and personal trading style.

Can technical analysis predict cryptocurrency prices accurately?

Technical analysis provides insights into potential price movements based on past trends, but it's not infallible, especially in the highly volatile crypto market. Considering market sentiment and external factors, it should be used as part of a broader strategy.

How important is volume in crypto technical analysis?

Volume is pivotal in technical analysis, as it confirms the strength of a trend or a potential reversal. Indicators like On-Balance Volume (OBV) can offer insights into the momentum behind price movements, enhancing decision-making.

What is the difference between technical analysis and fundamental analysis in crypto?

Technical analysis focuses on price movements and patterns, while fundamental analysis evaluates the intrinsic value based on external and environmental factors. Each serves different purposes; technical analysis is often used for short-term trading, while fundamental analysis is suited for long-term investments.

Can beginners easily learn and apply technical analysis in crypto trading?

Yes, beginners can learn and apply technical analysis, starting with foundational concepts like reading candlestick charts and understanding basic indicators. With patience, practice, and ongoing education, anyone can incorporate technical analysis into their crypto trading strategy for more informed decisions.

5 min read
The Impact of Value-at-Risk (VaR) Model at CVEX

Navigating the market's uncertainties requires intuition and strategy and a solid foundation in risk management. It's essential for traders to have a method to assess potential losses, preparing them for the inherent volatilities of the financial world. This is where Crypto Valley Exchange steps in, adopting the Value-at-Risk (VaR) model as a sophisticated tool for risk evaluation. The VaR model is a testament to CVEX's commitment to providing its users with advanced resources to manage risk effectively. Let's delve into the principles of the VaR model and how it transforms risk assessment on CVEX.

Understanding the Value-at-Risk (VaR) Model

The Value-at-Risk model stands out as a statistical measure designed to estimate the potential loss in the value of a portfolio over a defined period for a set confidence interval. VaR calculates the maximum expected loss under normal market conditions, offering traders a clear perspective on the risk associated with their positions. This ability to quantify financial risk within a specific timeframe is invaluable. It enables traders to gauge the extent of potential losses and adjust their strategies accordingly, fostering a more informed and cautious approach to trading. Through adopting the VaR model, CVEX empowers its traders with a quantifiable risk assessment, setting a new standard in the careful navigation of the financial markets.

3 Benefits of Using the VaR Model for Traders on CVEX

Efficient Capital Usage. The VaR model aligns margin requirements with actual risk exposure, reducing the need for excessive capital allocation towards margins. This allows traders to utilise their capital more effectively, enabling additional trading activities and enhancing portfolio diversification.

Dynamic Risk Assessment. Adapting to market changes and volatility, the VaR model ensures that margin requirements are always reflective of current market conditions. This adaptability helps traders stay prepared for fluctuations without the burden of unnecessary margins.

Enhanced Trading Safety and Stability. By providing a realistic measure of potential losses, the VaR model helps traders make informed decisions, significantly reducing the likelihood of unexpected losses. This contributes to a more secure and stable trading environment on CVEX.

The Calculation Methodology Behind CVEX’s VaR Model

At the heart of CVEX’s adoption of the Value-at-Risk model lies a sophisticated calculation methodology, meticulously carried out by Risk Oracles. Unlike the traditional historical method, which relies heavily on past return values and can be skewed by extreme market events, CVEX embraces a statistical approach. This methodology ensures a more balanced and comprehensive risk assessment by considering the full range of available data.

The process begins with the Risk Oracles assessing the historical prices of assets, converting these into log returns, and normalising them to eliminate bias. This preparation is crucial for accurately fitting the data into a statistical distribution model, moving away from the potential pitfalls of the historical method's sensitivity to tail values.

By utilising the entire data spectrum, the statistical method allows for a precise evaluation of potential losses, accounting for the complexities and nuances of market behavior. This approach not only mitigates the irregularities associated with extreme market conditions but also provides a more reliable foundation for calculating margin requirements.

In transitioning from the historical to a statistical methodology, CVEX ensures that its VaR model remains robust, responsive, and reflective of the true risk landscape. It's a testament to the platform's commitment to offering traders a reliable, nuanced, and scientifically grounded risk management tool.

Choosing the Right Distribution for Accurate VaR Results

Accurate VaR calculation hinges on selecting an appropriate distribution model that mirrors market realities, including the 'fat tails' characteristic of market return distributions. The t-distribution emerges as the superior choice over the normal distribution for several reasons:

  • Better Representation of Market Extremes: Unlike the normal distribution, the t-distribution can accommodate the heavy tails observed in real-world market returns, which are indicative of more frequent extreme price movements.
  • Fitting Log Returns with Precision: CVEX's Risk Oracles employ the Maximum Likelihood Estimation method to tailor the t-distribution to market data. This approach adjusts the distribution's parameters to capture the nuances of market behaviour accurately, enhancing the reliability of VaR calculations.

The Impact of VaR on Trading Strategies

Understanding and applying the VaR model significantly alters how traders approach risk management and decision-making:

  • Informed Trading Decisions: With a clear quantification of potential losses, traders can tailor their strategies to balance risk and return more effectively, avoiding positions that might expose them to unacceptable levels of risk.
  • Enhanced Risk Management: CVEX's implementation of the VaR model equips traders with a powerful tool for assessing the risk of potential trading scenarios, enabling a proactive approach to risk management. This detailed risk insight fosters confidence among traders, empowering them to navigate the markets more skillfully.

Conclusion

The integration of the Value-at-Risk model into CVEX's trading platform represents a significant advancement in risk assessment for traders. By adopting a statistical approach grounded in the t-distribution, CVEX offers a nuanced and realistic evaluation of potential market risks. This model enables traders to understand their risk exposure better and to make trading decisions that are informed by a comprehensive risk assessment framework. The ultimate benefit of employing the VaR model on CVEX is the empowerment it provides traders, allowing for strategic decision-making bolstered by precise risk analysis. This enhances not just individual trading outcomes but also contributes to the overall stability and safety of the trading environment on CVEX.

5 min read
No Funding Fees with CVEX

Ever wondered how much you're actually paying in funding fees while trading futures? 

CVEX stands out by offering a unique benefit for traders: zero funding fees. This not only maximises your trading profits but also distinguishes CVEX from other platforms.

Understanding Funding Fees

Funding fees are periodic payments made by traders when holding open positions in perpetual futures contracts. These fees are designed to align the perpetual contract prices with the underlying asset's market price. However, they can significantly eat into your profits, especially in a highly volatile market.

Typically, funding fees are calculated based on the difference between the perpetual contract's market price and the spot price of the underlying asset. Traders on the side of the contract that pays the fee (either longs or shorts, depending on market conditions) must pay funding fees to the other side at set intervals, often every 8 hours.

How Funding Fees work on perpetual futures trading platforms

Here's a simplified example to illustrate the impact of funding fees on your trading costs:

  • On platforms like Binance, if you open a 10x leverage position with a notional value of $1,000,000, you might end up paying a substantial amount in funding fees over time. These fees will cost you approximately 18% of the position's value yearly.
  • In contrast, on CVEX, a similar futures position would incur no funding fees whatsoever. The only costs would be the low trading and operational fees, making your trading endeavors more cost-effective and profitable in the long run.

This stark difference showcases how CVEX can lead to significant savings for traders, enhancing the appeal of futures trading on the platform.

By choosing CVEX, traders can enjoy the benefits of leverage and sophisticated trading strategies without the burden of funding fees, making each trade more efficient and potentially more profitable.

Case Study: CVEX vs. Binance

Funding fees significantly impact perpetual futures trading, affecting both strategies and overall profitability. Here's how CVEX distinguishes itself from platforms like Binance by using dated futures, which means eliminating funding fees totally.

Funding Fees Overview

The average funding rate for perpetual futures contracts in the market is 0.017% every 8 hours. This translates to a daily rate of 0.051% and an annual rate of 18.6%. Here we need to specify that funding fees are calculated from notional value. So if a trader opens a position with a value of $100,000 and 10x leverage, locking only $10,000 as a margin, he will pay 18% yearly from $100,000, not $10,000.

Also, please, take into account that these percentages are actual for the date we’re writing this article. Fees are changing constantly due to market conditions, so the next day fees can be bigger, let’s say 0.5%.

Comparative Analysis:

Binance Scenario:

  • Position: 10x leverage on a perpetual contract with a notional value of $1,000,000.
  • Initial Margin: $100,000.
  • Maintenance Margin: $50,000.
  • Trading Fee: $500.
  • Days till Liquidation: Considering the market's average funding rate, a position on Binance would last approximately 98 days before liquidation risks escalate, assuming constant contract value.

CVEX's Offering:

  • Position: Similar 10x futures with $1,000,000 notional value.
  • Initial Margin: $100,000.
  • Maintenance Margin: $50,000.
  • Trading Fee: Just $30.
  • Operational Fee: A negligible $0.3.
  • Funding Fee: Absolutely none, providing substantial cost savings.

Cost-Benefit Analysis

Choosing CVEX over Binance for futures trading means:

  1. Saving $470 directly on lower trading fees.
  2. Dramatically reducing costs by avoiding the 18.6% yearly drain from notional value due to average market funding fees.

The Financial Impact of No Funding Fees on Traders

Trading on CVEX comes with a distinct financial advantage that directly influences profitability – the absence of funding fees. This peculiarity can significantly affect traders' long-term outcomes, offering a more sustainable trading environment.

Benefits of No Funding Fees:

  • Enhanced Profitability. Without the burden of funding fees, traders retain a larger portion of their earnings, directly boosting profitability.
  • Long-Term Sustainability. The savings from not paying funding fees compound over time, making trading strategies more sustainable in the long run.
  • Competitive Edge. Traders on CVEX enjoy a competitive advantage, as they can operate with thinner margins, allowing for more flexible and aggressive trading strategies.

Conclusion

Choosing CVEX for futures trading presents a pivotal shift towards cost-efficient trading practices. By eliminating funding fees, CVEX stands out as an unparalleled choice for traders and organisations aiming to enhance their financial performance in the volatile crypto market.

The financial landscape of futures trading is evolving, with CVEX leading the charge towards a more equitable and cost-effective trading environment. By choosing CVEX, traders unlock a pathway to enhanced profitability, devoid of the burden that funding fees impose on traditional platforms.

Dive into a trading experience where efficiency and profitability are paramount. Explore CVEX today and discover how our unique approach to futures trading can revolutionise your financial strategy. With CVEX, you’re not just trading; you’re setting the stage for unparalleled financial growth.

Start Trading Now! 

Unleash your trading potential on CVEX. Visit https://cv.exchange to learn more and join a community of traders redefining success in the digital asset space.

5 min read
Benefits of CVEX for Traders and Organisations

The need for platforms that cater to both individual traders and organisations has never been more critical. CVEX, with its unique blend of decentralisation and capital efficiency, stands out as a beacon of innovation in this regard. This blog delves into how CVEX is changing risk management and trading for a diverse audience, highlighting its benefits for average traders and organisations.

For Average Traders

Gasless Operations. One of the most significant advantages CVEX offers to traders is the elimination of gas fees. Unlike other decentralised exchanges where every transaction can become costly due to fluctuating gas fees, CVEX ensures that your trading activities are not only efficient but also cost-effective. This feature alone can dramatically reduce trading costs, making it an attractive option for traders at all levels.

Anonymity Preserved. In a world where privacy is increasingly valued, CVEX offers the anonymity of decentralised exchanges without the common trade-offs. Traders can engage with the full experience of cryptocurrency trading without sacrificing their privacy, ensuring that their activities remain confidential.

Higher Leverage Options. For those seeking to maximise their trading potential, CVEX provides higher leverage than is typically available on the market. This allows traders to amplify their trading strategies, offering a significant advantage in both bullish and bearish market conditions.

For Organisations: Advanced Risk Management Tools

Enterprise-Level Risk Management. CVEX serves as an indispensable tool for organisations looking to hedge against market volatility. Through portfolio margining, the platform significantly reduces the capital required for hedging operations, allowing institutions to manage their risks efficiently without impacting their balance sheets.

Structured Products and Financing. CVEX’s platform is a goldmine for financial institutions and boutique firms aiming to offer complex financial products. Lower collateral requirements and fees mean that creating products like capital-protected notes or yield enhancement strategies becomes more feasible and profitable.

Multi-Platform Interoperability and Stablecoin Management. With features catering to seamless integration with other platforms and stablecoin management, CVEX ensures that organisations can protect against collateral asset devaluation while enjoying robust market connectivity.

The Comprehensive CVEX Ecosystem

Beyond individual traders and organisations, CVEX extends its offerings to a wide array of market participants. From retail investors to DeFi projects and DAOs, the platform’s composable architecture and efficient environment make it a versatile tool for various financial activities. Whether it’s for arbitrage opportunities, dynamic liquidity provision, or developing decentralised financial products, CVEX lays the foundation for innovation and growth.

The protocol’s asset-agnostic nature further reinforces its potential, supporting an extensive range of asset classes and paving the way for its application across both traditional and digital asset markets. This flexibility ensures that CVEX is not just a protocol but a comprehensive risk management infrastructure poised to redefine financial markets.

Conclusion

CVEX’s vision extends beyond mere transactions; it’s about empowering users with tools that were once the exclusive domain of institutional players. By democratising access to advanced risk management and trading strategies, CVEX is not just changing how we trade but also why we trade. It’s about creating a financial ecosystem that is open, efficient, and accessible to everyone, regardless of their background or market knowledge.

As we look towards the future, CVEX continues to innovate, inviting traders and organisations to explore and engage with a platform that truly understands their needs. With CVEX, the future of finance is not just arriving; it’s already here. Explore the vast possibilities with CVEX and join a growing community committed to revolutionising the digital finance landscape.

No results found.
Thank you! Your submission has been received!
Oops! Something went wrong while submitting the form.

Subscribe to our newsletter

Stay updated with the latest news and insights.

Thank you! Your submission has been received!
Oops! Something went wrong while submitting the form.

As seen in

See all the Crypto Valley Exchange ecosytem in media.